My name is George Sheldrake and I am a designer at the Ministry of Justice Digital Services (MOJDS). I have been working closely with the MOJDS research team and wanted to share some of my recent work on mapping services for the MOJ.
Visualising journeys
I have been working with the Civil Claims project where we have been building process maps to help understand the service from the perspective of both the business and the user combined. These have been immensely useful, as they mean we end up with a visual representation of a system that is often abstract or wide reaching. Here, I wanted to share our learnings.
Civil claims exemplar project: mapping a claim process
This project covers civil legal matters such as claims for money and property (eg faulty goods and services, unpaid invoices, evictions and repossessions).
We wanted the next direction for the project to be fed from both business and user needs.
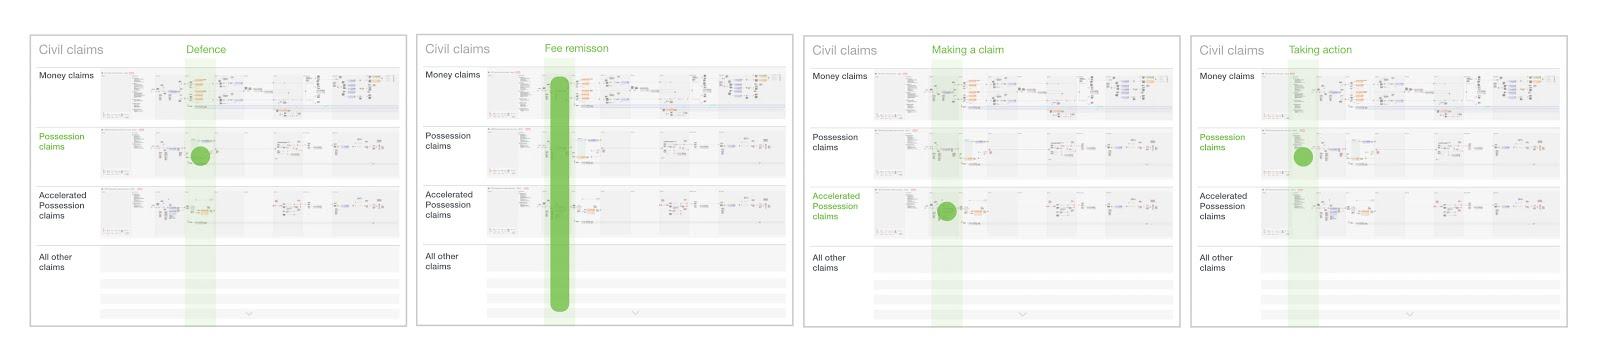
Previous work had focused on the journey of one claim type (Accelerated Possession), but now we needed to understand the bigger picture; what are the greatest challenges that individual users’ face across all civil claims? We knew that the users and the services themselves could be very different, so our first challenge was to understand four of the biggest claim types in more detail.
What are these maps?
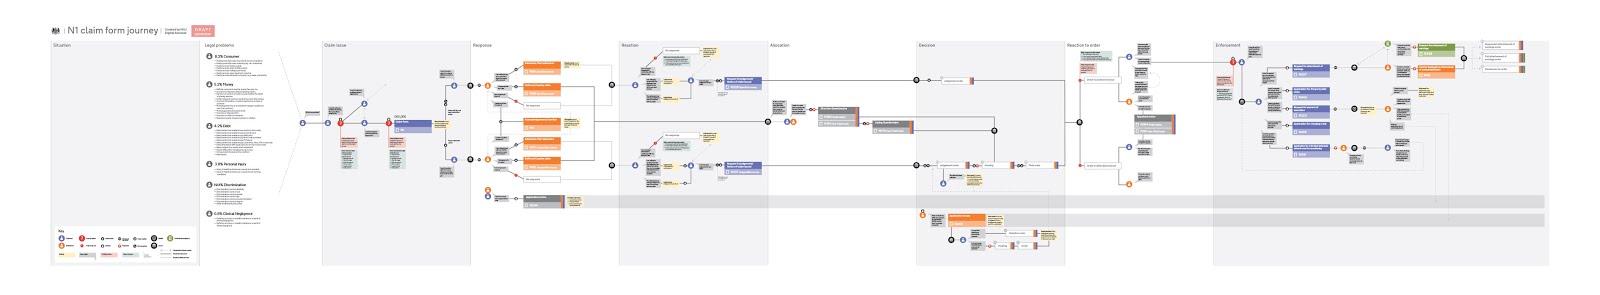
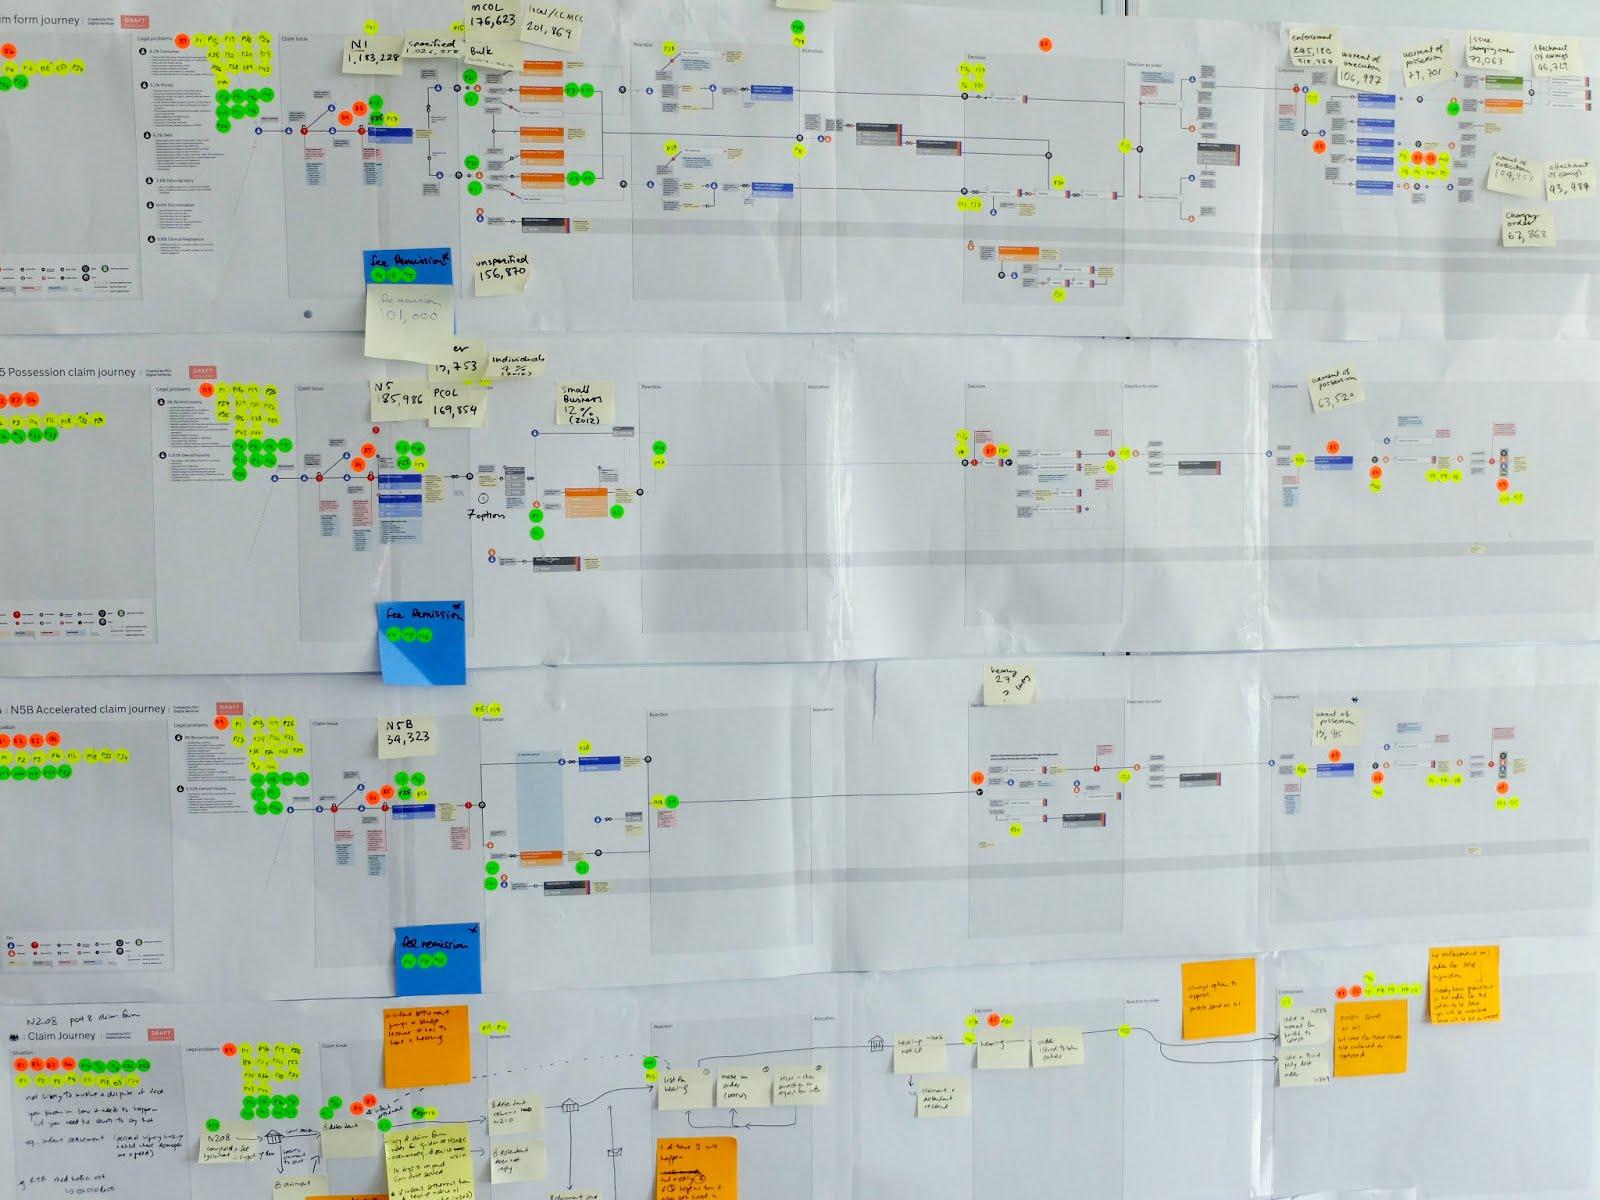
We wanted to see what their experience looked like as a journey from end-to-end alongside the decisions they took to go down different paths of the process. In essence, it is a map of the business process flow and decision points for the user, including: particular qualities, problems, requirements and outcomes.
How we made them
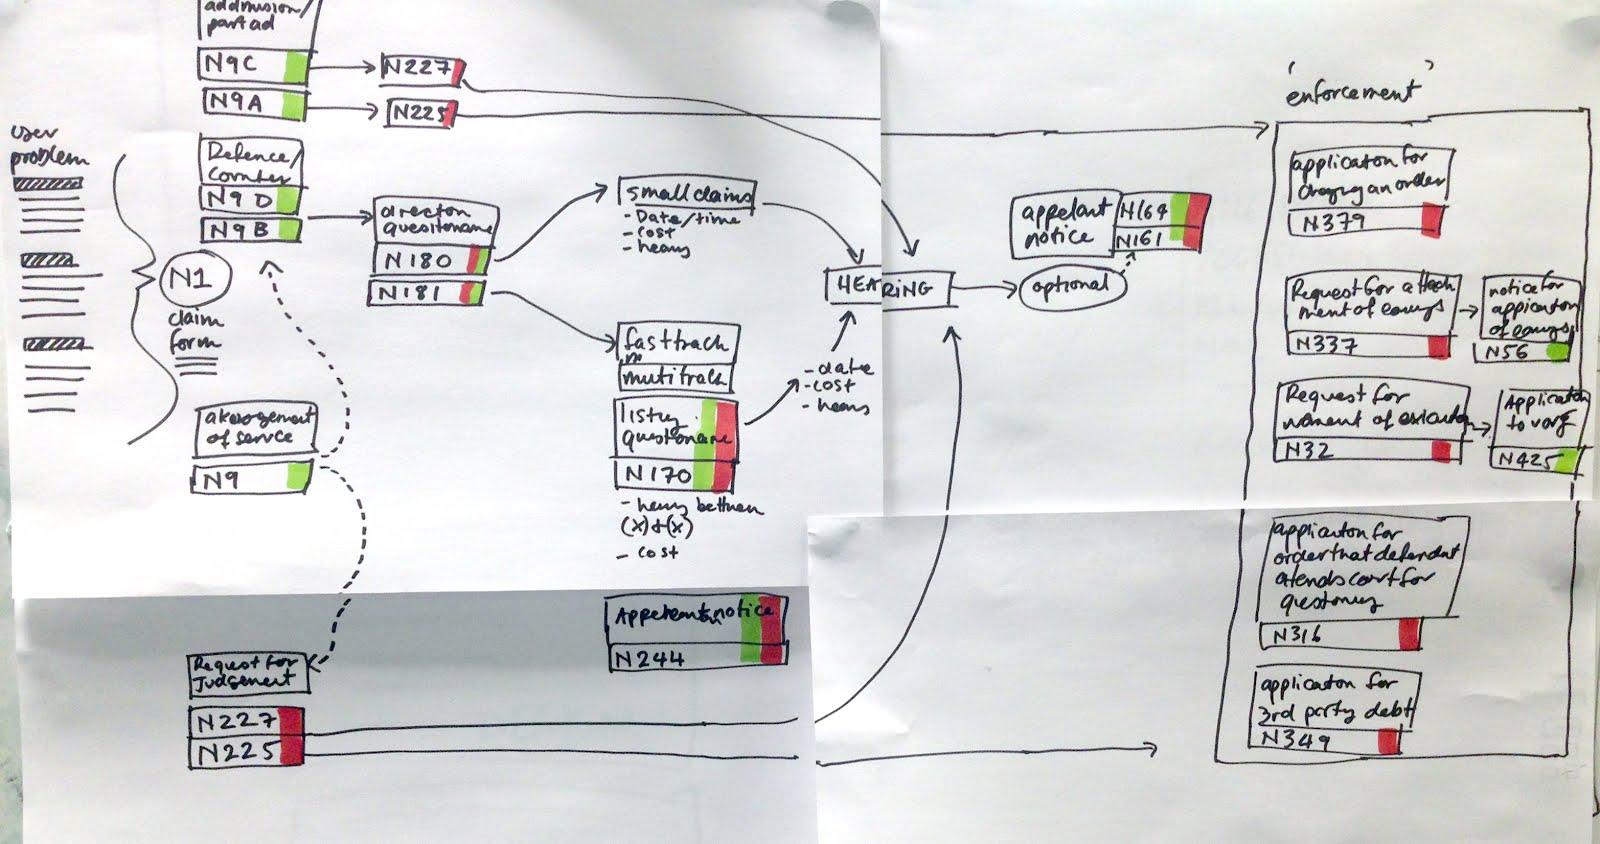
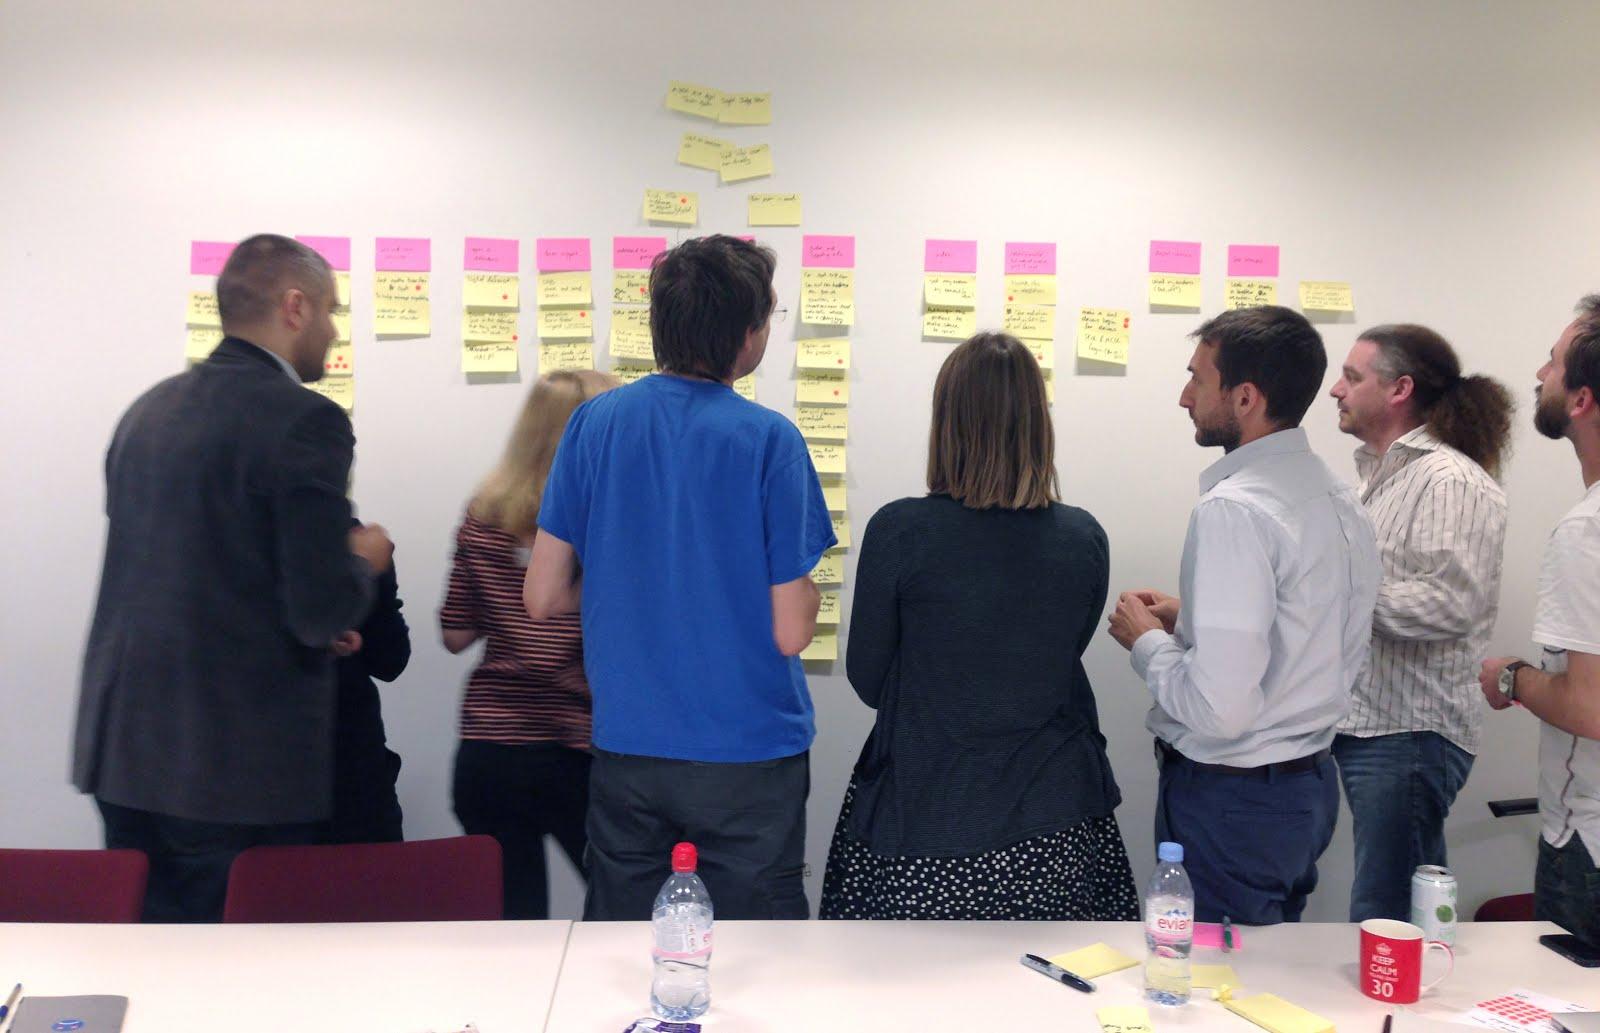
To draw the maps for Civil Claims we started by conducting a workshop. We invited domain specialists from the business to help us draw the map. We focused on money claims (the most complex type with the highest number of users: 1.2m claims). By the end of the workshop we had a first draft of money claims.
I then drew this up starting with paper sketches then moving it to a vector in Illustrator.
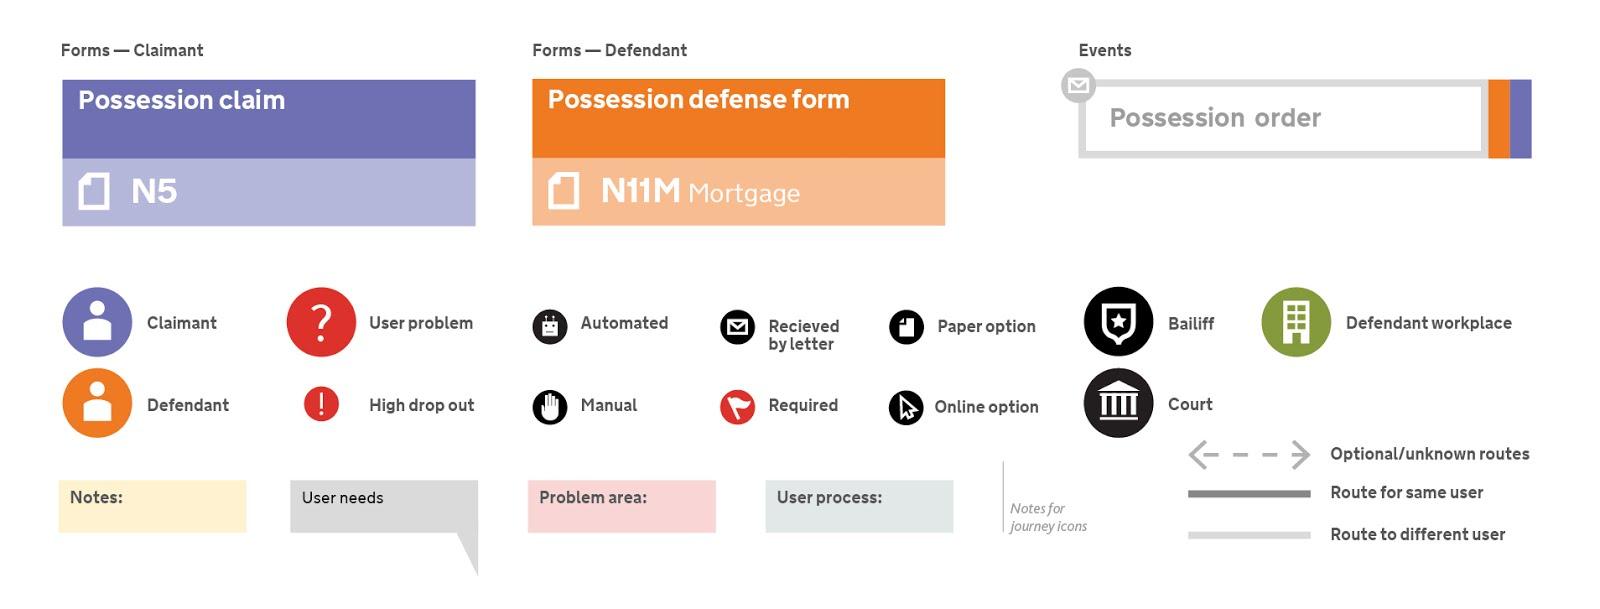
I created styles in Illustrator for the different things we had learnt such as qualities (eg channel), problem areas, user types, requirements/outcomes and touch points.
We discussed how it would be useful as a digital tool and working with one of our developers we experimented with a prototype. However we found that the first iteration just needed to be be the simplest and decided to continue with drawings at this stage.
We then went through rounds of changes with our domain specialist from Bristol, checking the facts were accurate. We then asked her to help map the following three claim types: Possession claims, Accelerated Possession claims and Injunctions.
What we did next
On Civil Claims we used the maps to plot user pain points. As a part of our research we met with frontline staff and support groups we conducted interviews we then mapped the pain points we found from this research.
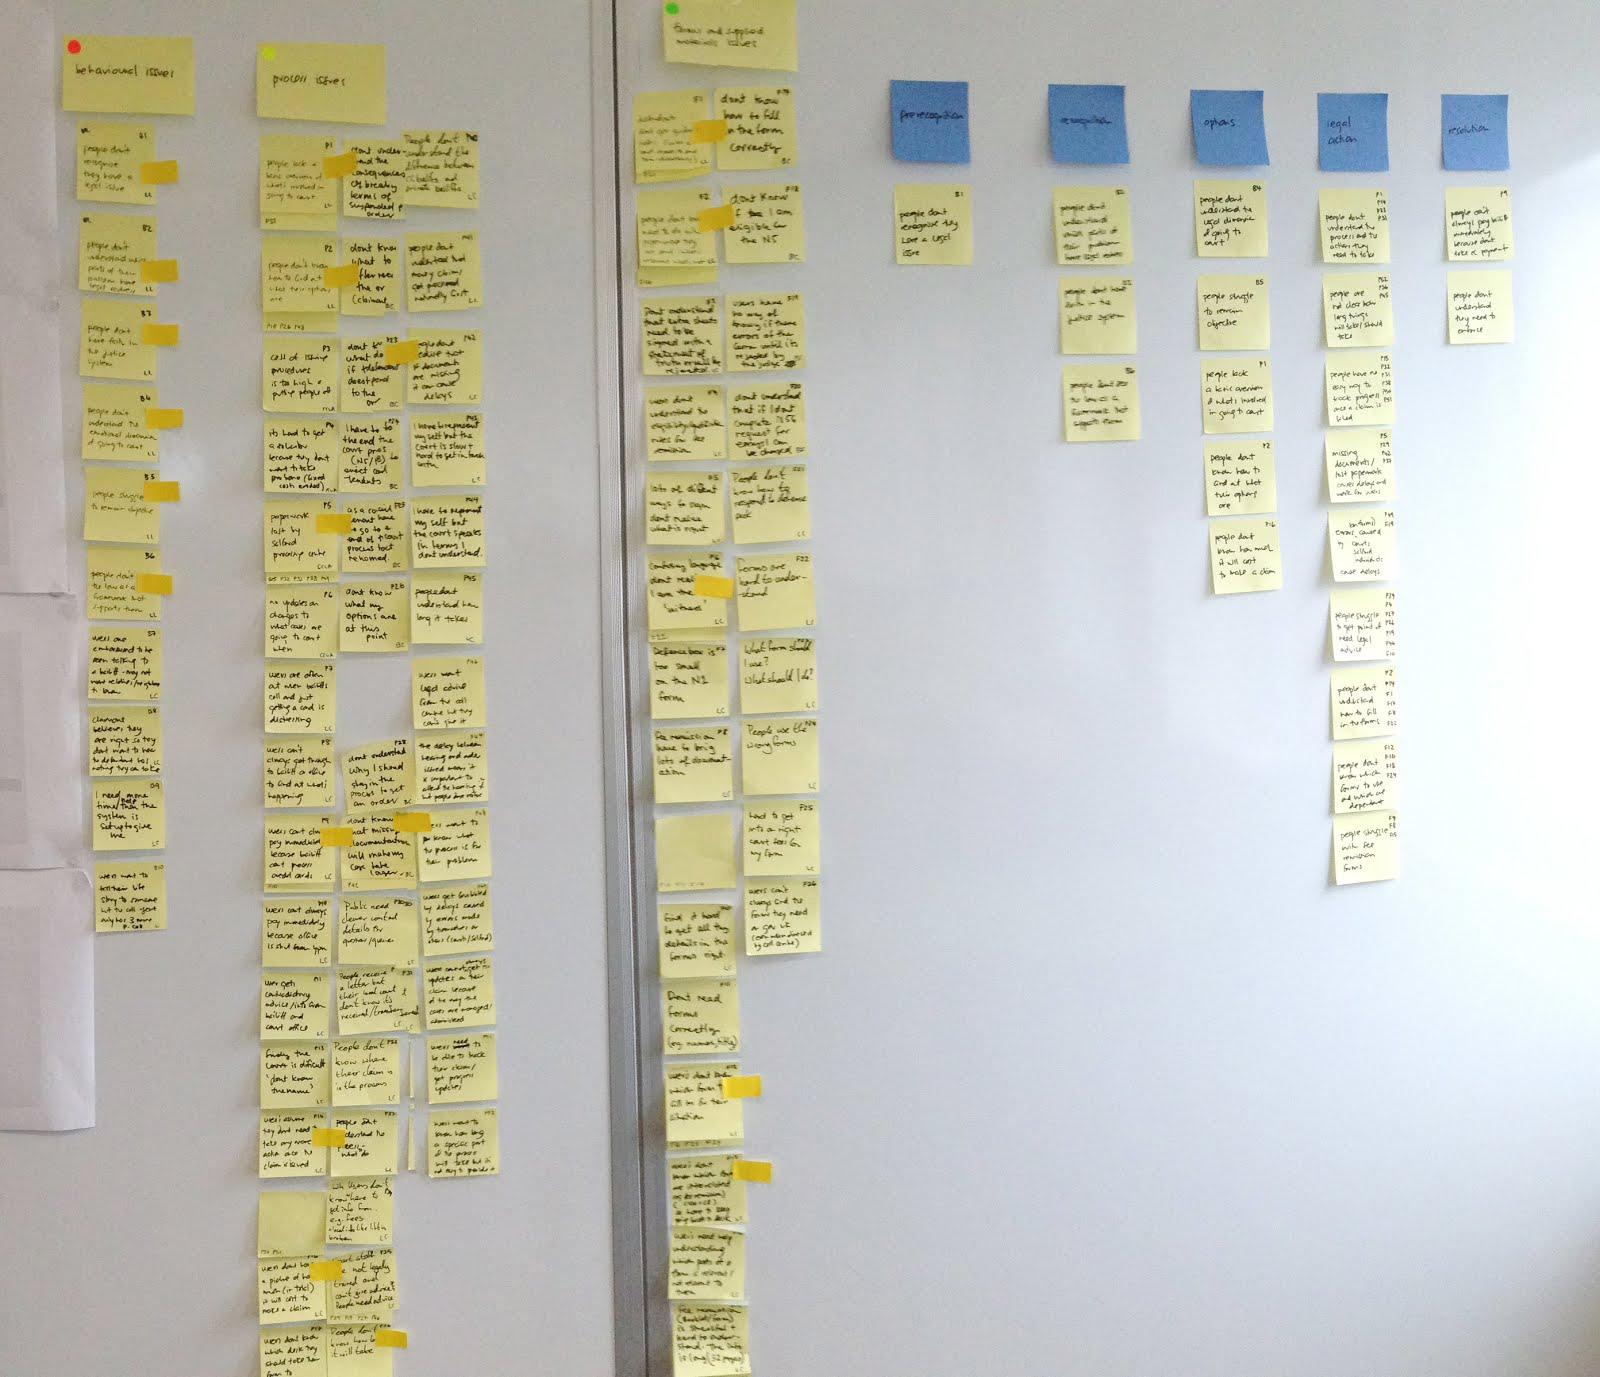
We coded each user issue with a number and colour (red for behavioural issues, green for process issues and yellow for forms and related materials). By placing sticky dots (with the issue number) for each problem on the map we could see visually that many problems were either common across the whole process and across multiple claim types or happened before the claim process even began.
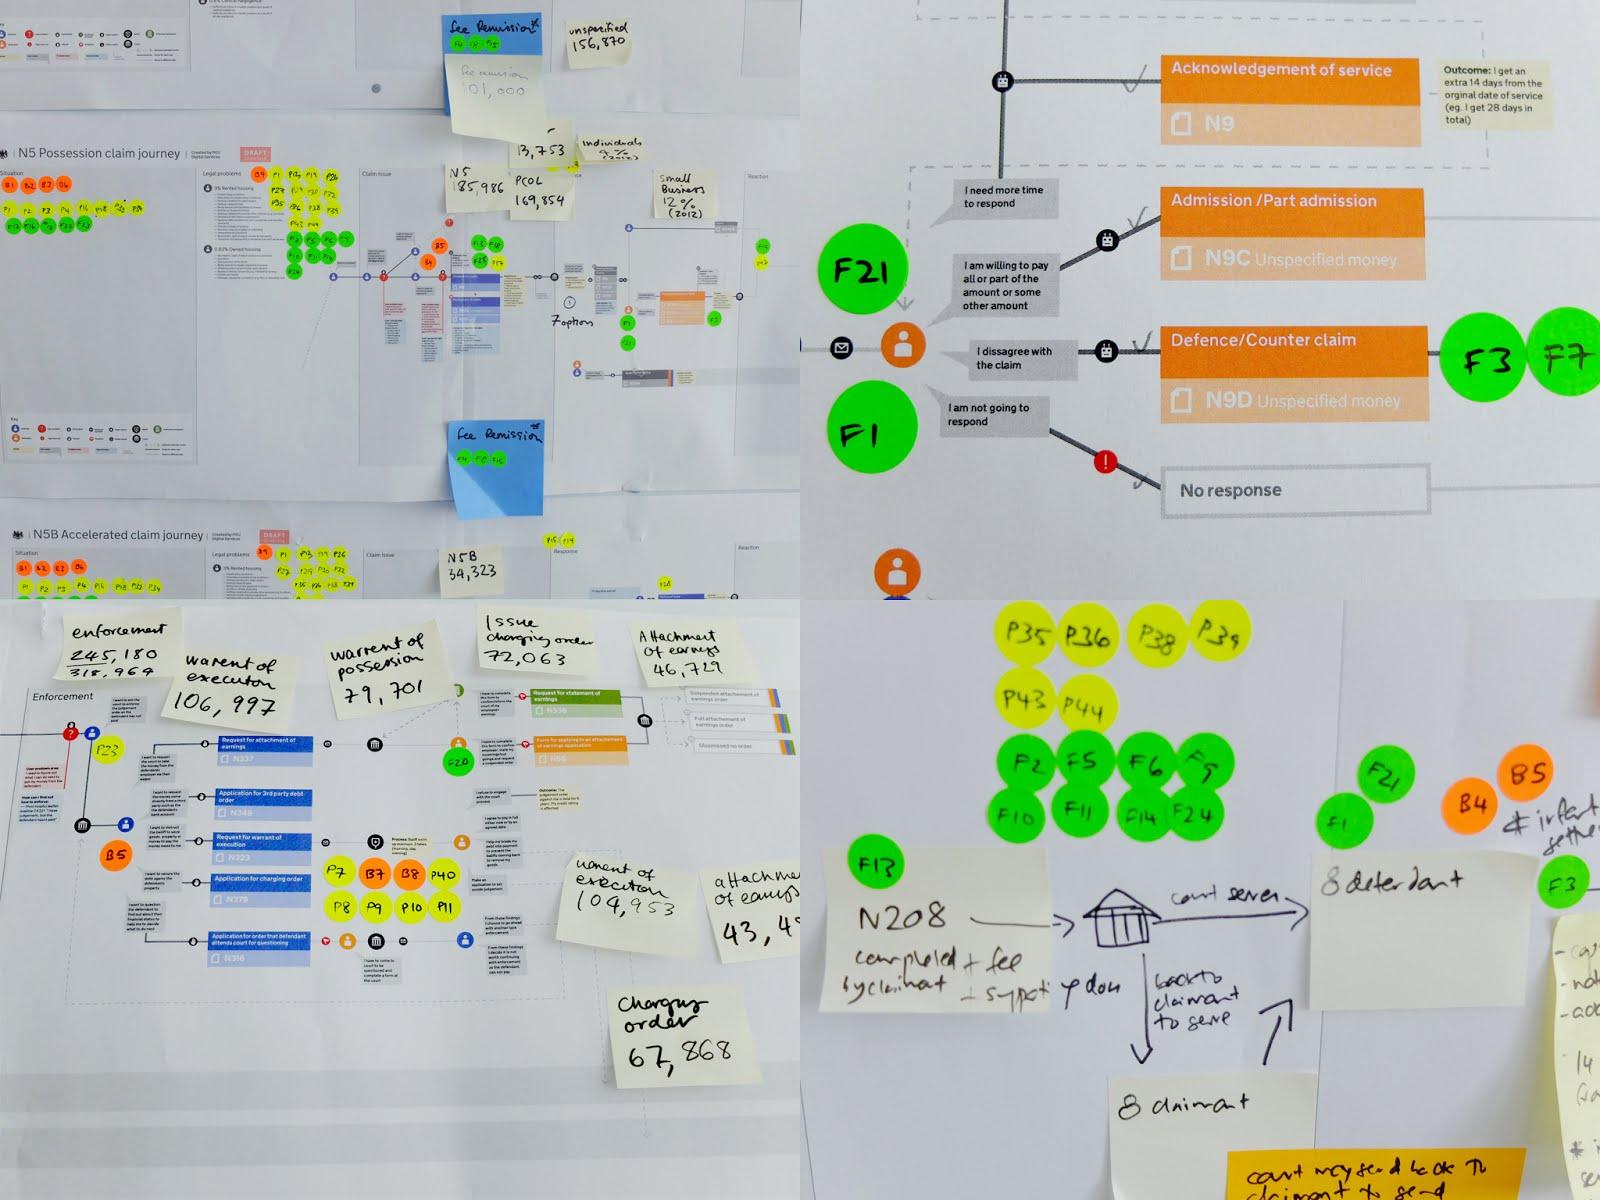
After reviewing the quantitative research we then added the volumes of users. This helped us to get an idea of the engagement of users at different points throughout the process helping us to determine ‘hot’ areas of interest; problem areas with high user numbers.
Following this we started user needs workshops with the whole product team, we created a set of concepts derived from our research findings. We compiled these with our ‘hot’ areas of focus as our proposed options for next steps for civil claims. These are now in discussion with our stakeholders.
The maps helped us:
- Get a better understanding of the claim process
- Understand the breadth and depth of the service
- Understand areas of user need
- See patterns across a number of claim types
- Create ideas for concepts directly for derived from user problems
- Expose parts of the journey not understood or recognised by the business
- Highlight hot areas for focus for next iterations
- Have a common approach on other projects, eg the Traffic Offences project
What we learnt:
- At the beginning of this process, it is easier to work at a lower fidelity for the maps
- The best results came from design and research working together
- Giving people a visual of the problem landscape made it easier for them to grasp it
- The map is a tool and artefact that is continually iterated on
Next steps
We are now looking at how these maps can be iterated to be used with more teams, as well how the maps could be used to capture more discovery phase needs, for example technology and systems information. We are also looking at using them as a starting place for designing new services.
If you would like to find out more feel free to get in touch: george.sheldrake@digital.justice.gov.uk or follow me on Twitter @georgesheldrake.

1 comment
Comment by David Carruthers posted on
This is great stuff, there's so much in here I'm going to have to read it a good couple of times to understand it all.
Do you think there's any overlap between journey maps and mental models (a la Indi Young)? They're clearly very different, but some of the processes to create them look similar. Do you think they can work together, or not really?
Really great stuff, thanks for sharing.