This two-part blog post describes a systems mapping process undertaken by the User Centred Policy Design (UCPD) team in MoJ Digital in partnership with several policy teams working in the prison and probation space. While this first post describes system mapping as an approach and methodology, Part 2, which will be released tomorrow, reflects on our co-creation process and the collaboration between digital and policy teams.
Over three 3-hour workshops and one full-day workshop, we worked with policy teams to develop a ‘map’ showing the many, inter-related issues that impact on whether prison leavers are able to maintain and re-establish strong, positive relationships with people and organisations in their home communities.
Why develop a systems map?
The ‘Prison Leavers’ project is a cross-government initiative, which seeks to better understand and identify opportunities to improve the social inclusion of people leaving prison. The challenges facing prison leavers are extremely complex. Recognising this, we want to bring together as many organisations as possible who make policy and deliver services for people leaving prison, to create a shared, system-wide understanding of the problems. We hope this will help us, as a sector, to clarify which approaches are most likely to have the greatest impact and identify new approaches to tackling these long-standing problems.
A system is a set of ‘things’ working together as parts of an interconnecting network or a complex whole. Systems thinking can help to tackle large complex strategic problems that need a multi-agency response. Many of the challenges governments face are these sorts of problems to which there is no clear answer — from reducing crime to better educating our children — and so we believe an understanding of how complex systems function is key to improving the way we address these challenges.
In her series on systems thinking, Leyla Acaroglu emphasises that systems thinking requires a change in mindset, from linear to circular. Everything that happens in society is interconnected and is essentially a set of relationships and feedback loops. Systems thinking is a language to communicate these complexities and associations. It also gives leaders a licence to operate differently, designing and delivering solutions with input from people and organisations working across the whole system, over the longer-term, and from a user’s perspective. This means we end up with answers that last longer, with better outcomes for the user and better returns on the money we invest.
Systems mapping helps us to understand all these ‘things’ — the entities of a system — and how they relate to each other. From here we can communicate understanding and develop interventions, innovations or policy decisions that will ultimately change the system in a positive way.
How we developed the systems map
To provide a starting point to our systems mapping process, we used the Omidyar Systems Practice Workbook as a rough guide. In parallel, we attended some of the STIG (Systems Thinking in Government) workshops to learn more about how systems thinking could help us on this journey. Our end goal of this phase was to create a systems map that would identify existing barriers, weaknesses, and opportunities, and highlight potential intervention points and insights, in a new way.
Our first workshop started with developing:
- a guiding star — a vision of how we would like the system to act
- a framing question — a clear statement to focus our minds on what we’re trying to understand
- exploring the forces that enable and inhibit the health and effectiveness of the system.
From here we developed 12 themes and started to identify causes and effects under each theme. The fun began when we started to create ‘cause and effect’ loops to focus on demonstrating the feedback loops (positive and negative) that drive critical behaviours within the system.
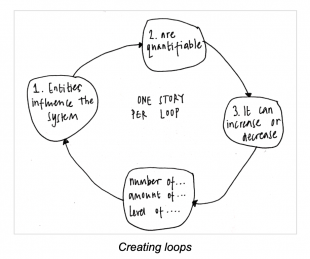
Each loop tells a story. We tried to limit each loop to one story and preferably one clear sentence, giving each loop a label so that readers can scan the map quickly and travel on a journey through the map. Our goal was to describe what is (current state), not what we thought the system should look like in the future.
When developing the map, it was important to ensure that each entity we added was expressed in a way that is quantifiable — as something that can go up or down. But this doesn’t mean everything has to be a number, it could be a feeling, for example, like the level of happiness or sadness experienced by a prison leaver or their family member.
 Finally, we found that it was important not to get stuck in one loop arrangement, but rather to continuously try new ways to think about the stories and connections.
Ilya Prigogine, one of the founding fathers of complexity science and systems dynamics, said that in a large complex system there are small islands of coherence that have the potential to change the whole system. The systems map that we have co-created is a cluster of islands that has the potential to work as a whole system.
As a result of our systems mapping we can start to identify small projects that will hopefully trigger cascades of change. This is where the power of design and digital teams can help to see and leverage potential and transform systems for good. We are not aiming to change the whole system in one go, our aim is to change the system by intervening around the edge with little projects that tweak the system in some way while not losing sense of that big systemic ‘picture’. We also recognise that every change we inflict on a system will have long-term and far-reaching repercussions, so we’ll need to monitor how the system reacts to each change and keep tweaking.
The next steps will be to use this map to identify and develop conditions for change and success under these four headings:
- Culture and attitude changes
- Policy changes
- Process changes
- Changes to resource allocations
We’ll be categorising opportunities for change in those four buckets because we believe culture and policy changes, while taking longer to create, ultimately have greater long-term impacts on a system than changes to processes or resource allocations. (We adapted Adam Groves’ system leverage map idea, which is itself based on Donella Meadows’ 12 leverage points for a system.)
Look out for Part 2 of this blog tomorrow, which will describe the facilitation process we used, and how we transitioned from a physical workshop situation to virtual facilitation and co-creation when COVID-19 meant we all had to begin working remotely.
